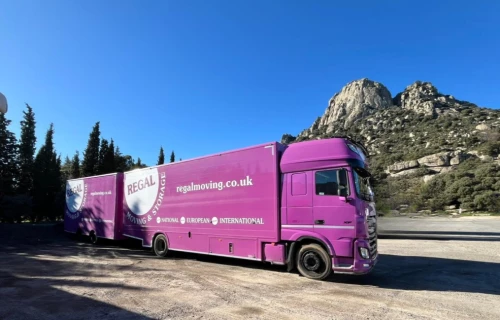

Key UK moving house statistics at a glance
- UK residential property transactions: 98,700 (seasonally adjusted, June 2026), up 2% year on year. Source: HMRC
- Average UK house price: £271,000 (May 2026), up 2.7% on the year. Source: HM Land Registry / gov.uk
- Net internal migration to Kent: 9,300 people (mid-year 2023 to 2024), out of 21,800 total net migration to the county. Source: Kent County Council, using ONS data
- Maidstone recorded Kent's highest net internal migration of any district in 2023/24, at 2,200. Source: Kent County Council
How Many Property Transactions Happen in the UK Each Year?
HMRC's monthly transactions data is the most direct official measure of how many home moves complete in the UK, since it counts actual Stamp Duty Land Tax, Land and Buildings Transaction Tax, and Land Transaction Tax returns.
| Month | Non-seasonally adjusted transactions | Seasonally adjusted transactions |
|---|---|---|
| June 2024 | 90,930 | 93,050 |
| June 2025 | 97,030 | 96,300 |
| June 2026 (provisional) | 103,050 | 98,700 |
Source: HMRC, UK monthly property transactions commentary
Financial year totals (April to June, the first quarter of each financial year) show the same recovery pattern:
| Financial year | Non-seasonally adjusted | Seasonally adjusted |
|---|---|---|
| 2023 to 2024 | 236,820 | 246,630 |
| 2024 to 2025 | 261,670 | 276,210 |
| 2025 to 2026 | 235,870 | 246,060 |
| 2026 to 2027 (provisional) | 282,010 | 297,640 |
Source: HMRC, UK monthly property transactions commentary
HMRC notes these figures represent completions, which happen on average two to four months after an initial offer, so they lag the current state of the market slightly.
What's the Average House Price in the UK Right Now?
According to HM Land Registry's UK House Price Index, the average UK house price was £271,000 in May 2026, up 2.7% over the year. Source: gov.uk, UK House Price Index for May 2026
Average prices vary significantly by nation and region:
| Nation | Average house price | Annual change |
|---|---|---|
| England | £291,000 (April 2026) | +3.9% |
| Wales | £212,000 (April 2026) | +3.5% |
| Scotland | £192,000 (April 2026) | +2.8% |
| Northern Ireland | £198,000 (Q1 2026) | +7.4% |
Source: ONS, Private rent and house prices, UK: June 2026
Within England, prices for May 2026 also split by how the purchase is funded:
| Transaction type | Average price (England, May 2026) | Annual change |
|---|---|---|
| Cash | £278,000 | +2.1% |
| Mortgage | £298,000 | +2.4% |
| First-time buyer | £244,000 | +2.3% |
| Former owner-occupier | £356,000 | +2.3% |
Source: gov.uk, UK House Price Index for May 2026

Which Months Do People Move House Most?
HMRC's transaction data lets you compare the same month across different years, which shows how much March completions are distorted by Stamp Duty deadline effects rather than genuine seasonal demand.
HMRC's own commentary flags two clear non-seasonal spikes worth knowing about if you're comparing month to month:
- March 2025 saw a large peak in transactions, followed by a drop in April 2025, because completions were brought forward ahead of Stamp Duty Land Tax (SDLT) threshold reductions that took effect from 1 April 2025.
- March, June and September 2021 all saw large peaks caused by buyers taking advantage of temporarily increased nil-rate SDLT, LBTT and LTT bands during the pandemic period.
Source: HMRC, UK monthly property transactions commentary
Outside of these tax-driven spikes, HMRC's data shows transaction volumes are generally higher in the April to June financial-year-start window than later in the year, though the exact busiest month shifts from year to year rather than falling on a fixed date.
Where Do People in the UK Move To? Kent and the South East
Kent County Council publishes its own migration bulletin using ONS mid-year population estimates, giving a district-level view that the national data doesn't provide on its own.
In mid-year 2023 to 2024, Kent recorded a net population increase of 21,400 people (1.3%), driven mostly by migration:
| Measure | Kent total, mid-year 2023/24 |
|---|---|
| Net internal migration (from elsewhere in the UK) | 9,300 |
| Net international migration | 12,700 |
| Total net migration | 21,800 |
Source: Kent County Council, Migration in Kent 2024, using ONS mid-year population estimates
Net internal migration (people moving in from elsewhere in the UK, minus people moving out) varied widely by Kent district in 2023/24:
| Kent district | Net internal migration, 2023/24 |
|---|---|
| Maidstone | 2,200 |
| Swale | 1,600 |
| Thanet | 1,300 |
| Tunbridge Wells | 1,100 |
| Tonbridge & Malling | 900 |
| Sevenoaks | 700 |
| Dartford | 800 |
| Dover | 800 |
| Folkestone & Hythe | 500 |
| Ashford | 400 |
| Gravesham | -100 |
| Canterbury | -1,100 |
| Medway | 0 |
Source: Kent County Council, Migration in Kent 2024
Maidstone recorded the highest net internal migration of any Kent district in 2023/24. Canterbury was the only district with negative net internal migration that year (more people left for elsewhere in the UK than arrived), though the bulletin notes Canterbury also had Kent's highest net international migration (2,900), so its overall net migration was still positive. Net figures also understate actual movement: Sevenoaks had the lowest overall net migration in Kent for 2023/24, yet still saw 9,200 people move in and 8,100 move out during the year.
Source: Kent County Council, Migration in Kent 2024
.webp)
Sources
- HMRC, UK monthly property transactions commentary
- HM Land Registry / gov.uk, UK House Price Index for May 2026
- ONS, Private rent and house prices, UK: June 2026
- ONS, Internal migration in England and Wales (dataset)
- Kent County Council, Migration in Kent 2024
This page is updated as new official data is published. Last compiled August 2026.
UK Moving House Statistics FAQs
HMRC recorded 98,700 seasonally adjusted UK residential property transactions in June 2026 alone, up 2% on June 2025. Financial year 2026 to 2027 has so far recorded 297,640 seasonally adjusted transactions (April to June). Figures are published monthly by HMRC and cover completed transactions rather than every house move, since not every move involves a purchase.
Planning a Move in Kent or the South East?
Regal Moving & Storage covers removals across Kent and the wider South East, backed by BAR membership and the BAR Advanced Payment Guarantee.
Contact us today for a free, no-obligation quote.